Rarity is just super heavy on CPU ? maybe a bug ?
Evonos opened this issue · 6 comments

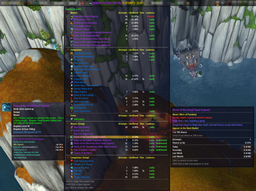
This is during an raid boss
https://imgur.com/vibmHdj
Its extremely HEAVY.
this is on cauldron fight
https://i.imgur.com/g504xUX.png
is this intended ?
are there any settings to make it lighter ?

No, that's definitely not intended. Does it only happen during raid encounters? If so, it might be due to the many combat log events.
I don't have time to investigate right now, but if you can get more detailed traces it would help narrow down the issue.
Rarity does have a profiling mode. Perhaps that'll give more insight if run at a world boss or "low-stakes" raid fight (it's very taxing). You could try enabling it and check the results (button in Advanced settings), then compare with the Addon Profiler data?
Otherwise I can look into the problem later, but no ETA since it might take a while until I get around to it.
No, that's definitely not intended. Does it only happen during raid encounters? If so, it might be due to the many combat log events. I don't have time to investigate right now, but if you can get more detailed traces it would help narrow down the issue.
Rarity does have a profiling mode. Perhaps that'll give more insight if run at a world boss or "low-stakes" raid fight (it's very taxing). You could try enabling it and check the results (button in Advanced settings), then compare with the Addon Profiler data?
Otherwise I can look into the problem later, but no ETA since it might take a while until I get around to it.
it basicly is allways quite heavy even just on the outer world usually idling around in the top 2-4 addons ( including the profiler addon which is understandingly heavy )
But during raid encounters its going insane , doesnt matter if world boss or cauldron , or the first boss and stuff its quite insane.
ill check tomorrow the rarity Profiler and compare maybe i join a few worldbosses or so might be the easiest way to compare its usually also allways a full raid which makes it kinda "samey"
it basicly is allways quite heavy even just on the outer world usually idling around in the top 2-4 addons ( including the profiler addon which is understandingly heavy )
That doesn't seem right. I checked the CPU usage after reading about Blizzard's profiling API changes, and it was negligible.
There's a known issue where showing the tooltip can take too long, but it wouldn't show up in the trace after an encounter.
I'd also expect the profiler addon to be a lightweight UI on top of the API. Either way, without more data I can only guess :)
Just noticed the metrics won't be collected for combat log events. You'll need to get r742-alpha-2 and enable profiling.
FWIW, I don't see anything indicating there would be a problem in Rarity causing the excessively high CPU usage:


The above was after a world boss with debug and profiling logs enabled. Unfortunately that's all the time I can spare right now.
Feel free to post your results; I'll take another look later. You could try disabling all other addons in case it changes anything.
So just a bit more info ,
This is just standing around in undermine ( Roughly 3 minutes )
https://i.imgur.com/vBLYGnE.jpeg
Mind you SAM and the Profiler have full profiling atm On ( hence why they are such giant cpu uses now )
During Undermine Worldboss sorted by Average ( Both sam and Addon profiler , iam not sure if SAM uses the blizzard API )
https://i.imgur.com/fsptNoK.jpeg
After Boss fight
https://i.imgur.com/4x3hVSS.jpeg
During Worldboss Just 3 addons enabled ( Sam , addon profiler , rarity. )
https://i.imgur.com/EAoDxCz.jpeg
After Raidboss
https://i.imgur.com/HmEkHHn.jpeg
What i observed , Even idle and with no other addons ( Except the 2 profiler ) Rarity spikes sometimes to 27 % or beyond.
What i also Observed the more Raid ? frames maybe just frames in general are displayed the worse Rarity gets , basicly leaving the raid made Rarity reduce HEAVILY.
That doesn't look like a performance problem to me? If there's FPS drops, you'll have to get the actual profiling data. If you enable both profiling and debug mode, using the latest alpha, you can then use the button in the Advanced settings to inspect it.
The screenshot you originally posted looks a lot more problematic. But without actionable data I can't do much about it.